How To Monitor 404 Hits on Framer
PUBLISHED:
UPDATED:
You may already know what a huge fan I am of Framer, based on my Framer SEO review here.
But how do we monitor and log 404 errors on our Framer site, without an extra plugin? Thankfully it's pretty easy, if you're using Google Analytics (GA4) or other analytics solutions like Plausible.
In this post, I'll take you through the quick process I used to set up 404 logging via Google Analytics.
This was something I had to do recently after eliminating an old site I had and sending it here, to make sure I can catch any URLs I didn't redirect properly.
You just need a custom 404 page, Google Analytics 4 (or your own analytics solution,) and a lil' snippet of code. Here's the whole setup.
Step 1: Set up your custom Framer 404 page
I'm going to assume you already know what a 404 page is since you're on this post.
Framer lets you design your own 404 page instead of showing the default one. Follow their lesson here: Custom 404 Pages in Framer.
Make it useful and branded, or as simple as you want.
Step 2: Make sure Google Analytics is installed
You need GA4 or other analytics running on your site before any of this works. If you haven't already instsalled it, time to get it set up.
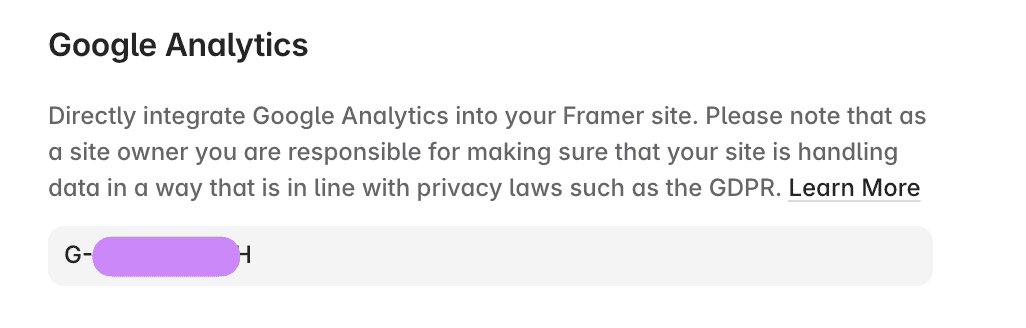
In Framer, go to Site Settings, then in the General area, scroll down to the Google Analytics section. Make sure your custom ID is pasted there.
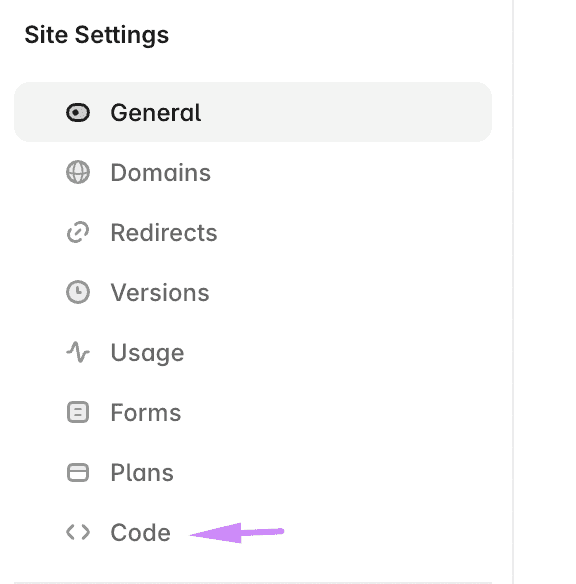
If you're using a different analytics solution, you'll need to add it the overall tracking snippet they provide via the code area:
Step 3: Add your custom 404 tracking code
Now you're going to write and add a custom snippet, specifically to the 404 page.
Here is the snippet I used for GA4, which will log the 404s as a "logged_404" event.
To add this to Framer, pop into the "Code" area of your settings in the last screenshot.
Click "Add" to add a new script, and set it up like this, with it firing specifically on your 404 page and at the end of body:
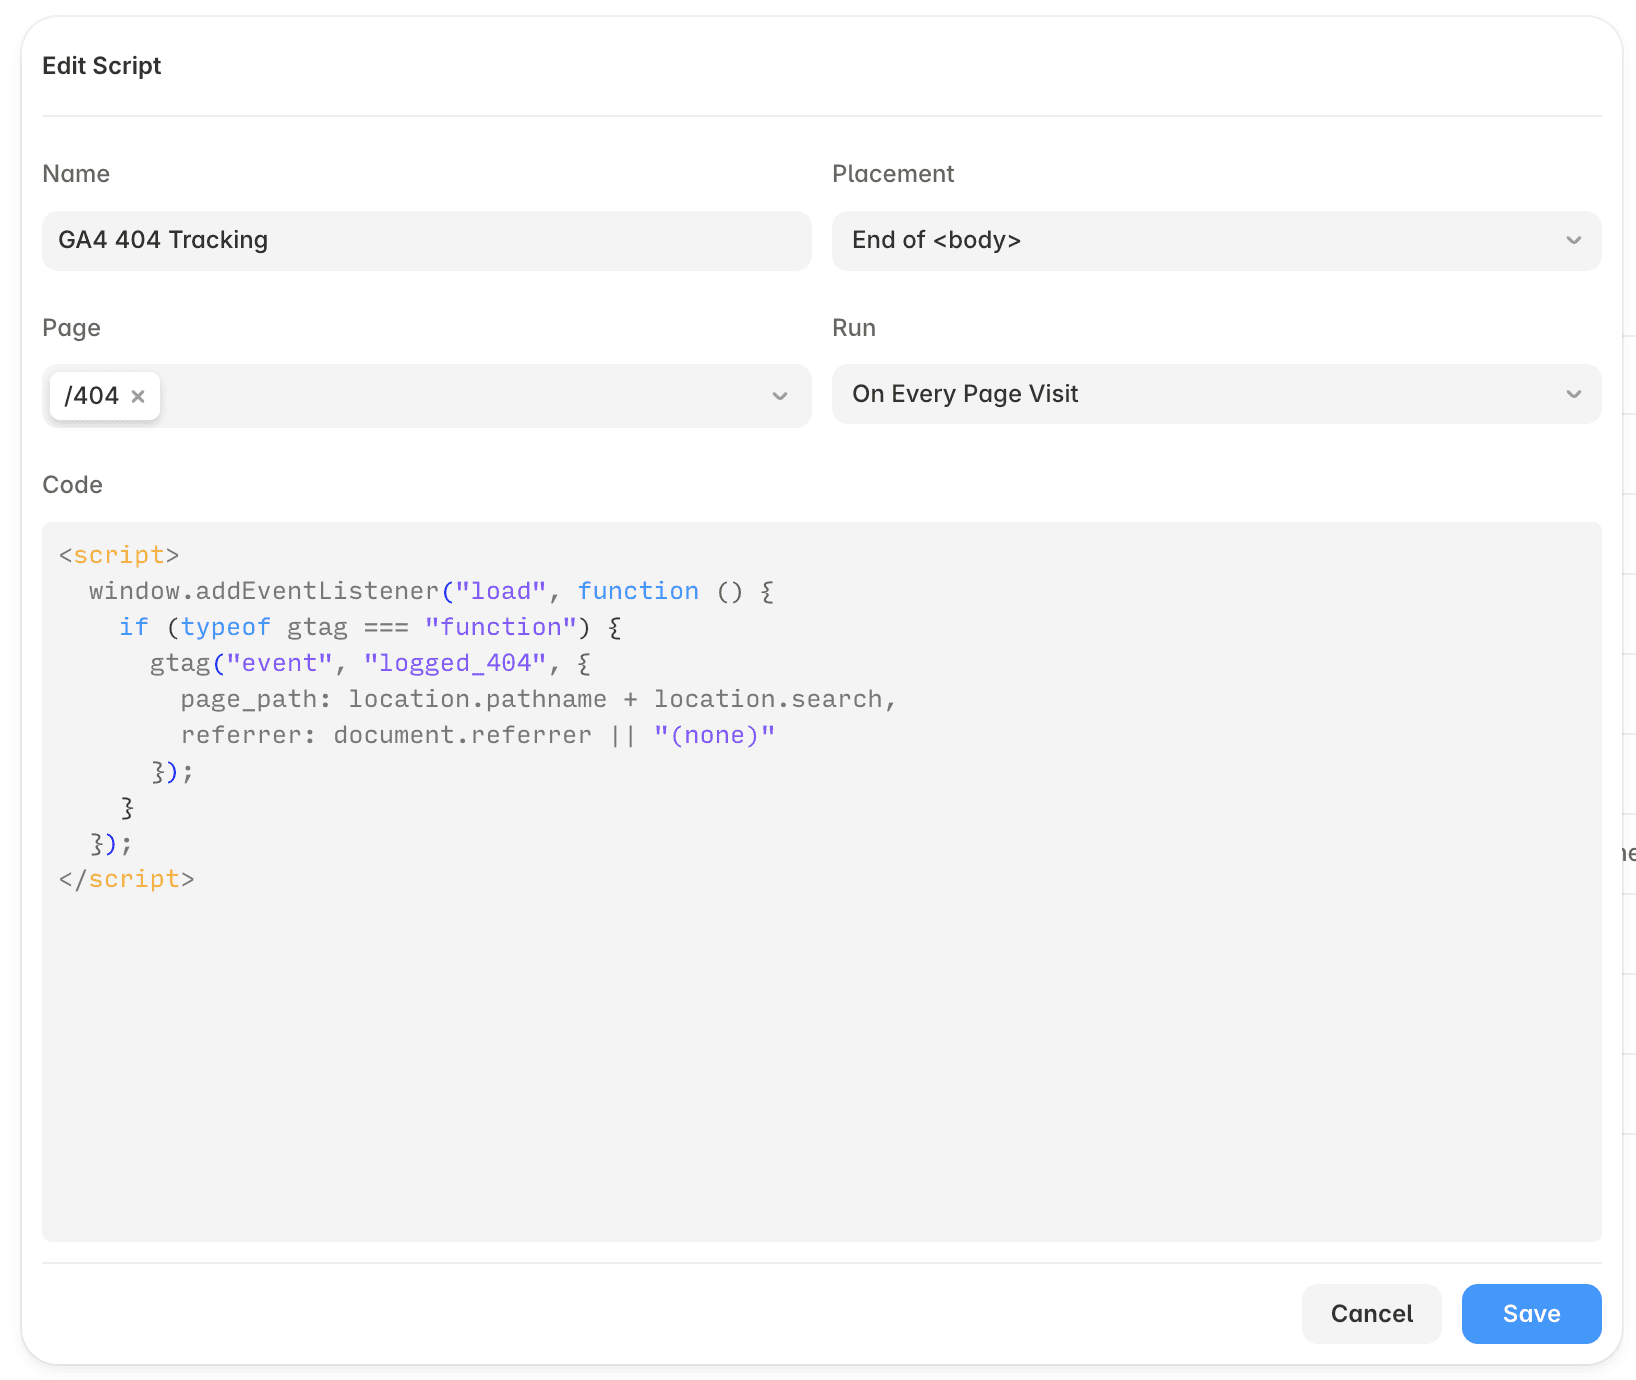
It will fire a custom event called "logged_404" when someone lands on your 404 page, and it captures the URL and where they came from.
If you're using a different analytics tool, pick an AI to help you come up with a code.
Step 4: Verify it's working
1. Open your site in a regular Chrome incognito window.
2. Open DevTools with Cmd+Option+I on Mac (or F12 on Windows) and go to the Network tab.
3. Type "collect" in the filter box.
4. Visit a fake URL on your site, something like `yoursite.com/random`.
You should see a request to Google Analytics like this, containing "en=logged_404" because that's the event name we set up. I know these characters look like a foreign language, but notice how you see the "logged_404" on the second line toward the end? That's what you're looking for.

You can also check your RealTime or Debug reports, but that didn't work for me because I have tracking filtering to keep out my IP.
Step 5: Add Custom Definitions
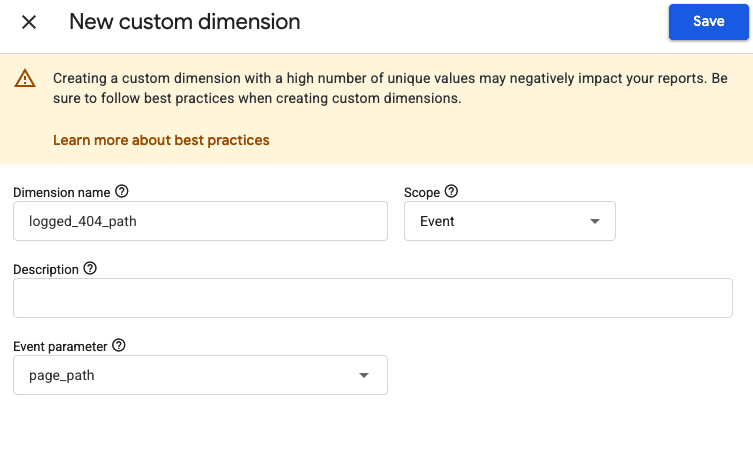
Now you're going to define the extra event parameters in your data settings. Go to your admin area, then scroll to Data Disply, then click Custom Definitions:
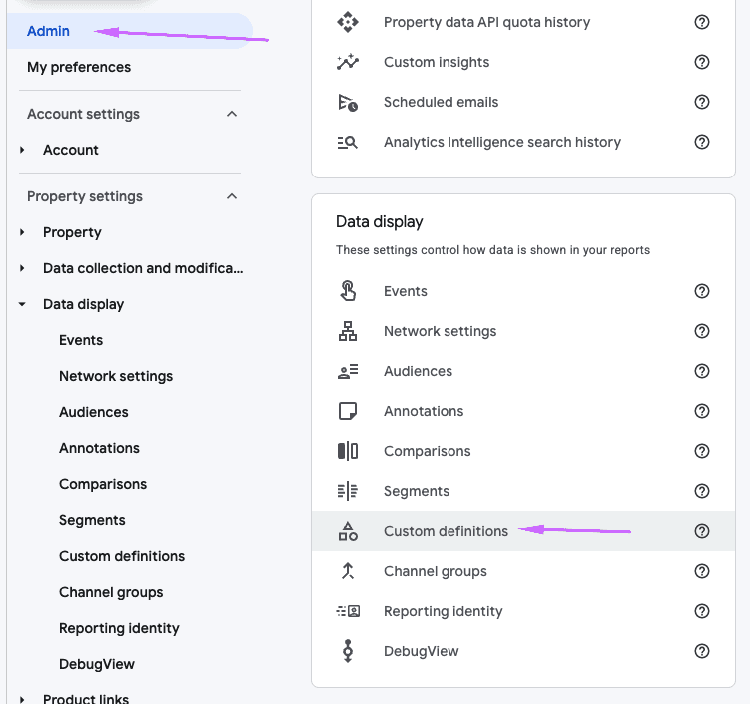
In there, you'll add new custom dimensions for the path and the referrer, like this one shown for the path:
Here's how mine look like once set up:
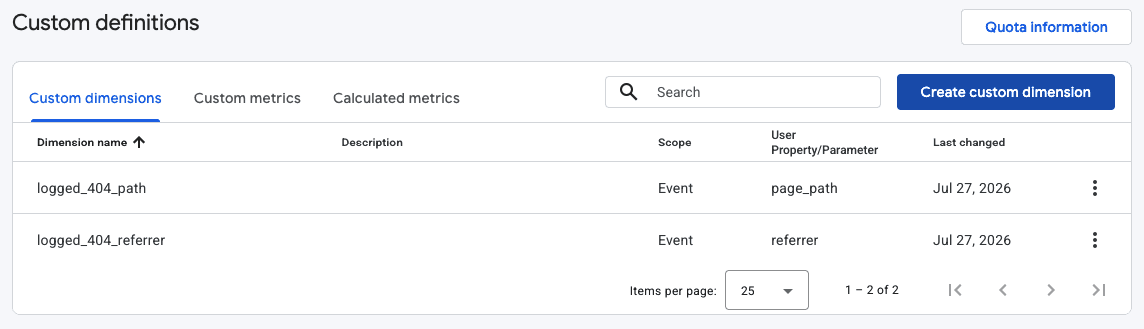
That will allow you to see which paths kicked off the 404 log.
And you're done!
That's it. Free 404 monitoring with no plugin, with just a couple minutes of setup.
Note that this will only work for scenarios where GA4 is able to track your visitors. For example non-Safari users, and people who have allowed cookies.
Just come back to your reports and find that event later to find and fix your 404s!

By Hannah Carol
Hannah is a long-time SEO expert and website marketing strategist. She has been optimizing websites since 2010, and was previously VP of Operations at an SEO agency before starting her own SEO and web design business in 2016. She has worked with brands like Beyond Yoga, Gerber Childrenswear, Sanctuary Clothing, and dozens of small independent businesses helping them improve their SEO and build websites that work to grow their business. She's a Wordpress geek, Squarespace Circle member, and now shares her knowledge with others at TheSEOKitchen.com.